|
By NiKo - Sunday, February 12, 2017
|
I just finished reading The Seven Daughters of Eve by Bryan Sykes, and on page 292 he suggests using matrilineal trees to track the passing of mitochondrial DNA.
Since one of my trees is a One Place Study with a lot of endogamous marriages, I'd like to display matrilineal trees as well as patrilineal. Is there an easy way of doing this? I was thinking of just creating a new genomap, and labelling it mt1, mt2, etc and hyperlinking in individuals. If someone had their mtDNA tested, I could relabel the genomap with the correct name. Is there an easier, more elegant way to do this? Any thoughts on the downside of all this extra effort?
|
|
By GenoProSupport - Wednesday, February 15, 2017
|
|
GenoPro would love to help people with their DNA genogram, however I have no clue how to do it. Do you have any suggestions?
|
|
By NiKo - Saturday, February 25, 2017
|
I haven't done a DNA test yet or set up a surname project yet, to see which tools are available on the sites. So, I can't really start stating what a suggested list of requirements would be.
The instructor to the Intro to Genetic Genealogy course I took maintains 2 separate trees. One in her regular genealogy software, and another in the company that she tested her DNA with. |
|
By NiKo - Friday, June 30, 2017
|
I'd like some help on creating a "Who To Test" Template or report,
I've attached a .gno template file, with copious notes on the 4th genomap re: labelling and colour coding.
The generated report can be found here: http://familytrees.genopro.com/Niko/WhoToTest/default.htm
Here are a couple articles from a blog to get familiar with the DNA testing acronyms:
https://dna-explained.com/2017/03/16/concepts-who-to-test-series/
https://dna-explained.com/2012/10/01/4-kinds-of-dna-for-genetic-genealogy/
- I'm using the first name, family/maiden name, and 2nd last name fields for Y-DNA (paternal) and mt-DNA (maternal) tracking. Is there a better way to do this with Custom Tags, and change the labels from tracking Addiction/Mental/Medical related issues to tracking Y-, mt-, autosomal, and perhaps X-DNA? Maybe add a DNA Toolbar?
- Is there a way to highlight, "tested" vs "anticipated" or "expected" results?
- For example, I got my Y-DNA tested (purple in the tree). I would expect my father's, paternal grandfather's, paternal great-great-grandfather's etc to all match mine, other than minor mutations. Unfortunately, I can't test them since they are all deceased, but I would assume the male descendants of those ancestor all have the same Y-DNA as me, unless there has been a NPE (Non-Paternal Event, or Not Parent Expected) ... (ie, adoption, infidelity, someone assuming a family surname, etc).
- My thought was to have one colour for people that have been tested, and perhaps a lighter tone of that colour for extrapolating the results. I am waiting to get my mt-DNA results back (pink in the tree). Once I know mine, I can assume my sister's, mother's, maternal grandmother's, maternal uncle's, maternal aunt's, children of my maternal aunt, etc, etc all match me.
- Is there a way to attach small logos to an individual to show which companies and which tests they have done?
- Testing companies: eg, Ancestry, FTDNA, 23andMe, National Geographic, etc
- Tests: Autosomal, mt-DNA, Family Finder, Y-12, Y-25, Y-37, Y-67, Y-111, Big Y, etc
- Include multiple kit tracking numbers. eg., You get a kit tracking number with FTDNA, and then upload your raw data to GEDMatch and get another kit tracking number. If you have enough people tested, you can run their kits through 3rd party tools, like Lazarus, and recreate (some of) the DNA of deceased relatives ... and you get another kit number.
- I've included a Legend on the genomap, and I love that it automatically displays a count of which people have a particular label, and includes summaries such as the following in the Comments/Tool Tips:
- The following 5 Individuals share those colors:
- GG-Grandmother mt-DNA z (ind00017)
- G-Grandmother mt-DNA z (ind00010)
- Grandmother mt-DNA z (ind00006)
- Sister mt-DNA z (ind00004)
- Mother mt-DNA z (ind00003)
- However, when I generate a report, the tool tip and comment are no longer available or accessible. Am I doing something wrong, or is that a limitation in my PC? browser? the report generator? Please look at the genomap named "0 Combined"
- It would be great to also generate a Matrilineal tree, in addition to the Patrilineal. Or somehow display multiple views of the same people/family groups .. It gets a little confusing/overwhelming having all these different colours on one genomap. It would be nice to have:
- genomaps by Surname .. or Y-DNA
- genomaps by matrilineal descent or mt-DNA, or maybe just a matrilineal report?
- show the evolution of household, ie be able to reproduce the example of the Fonda family in the McGoldrick Genograms book.
- I am doing all my testing with Family Tree DNA, although some of my cousins have been tested with Ancestry and/or National Geographic. I prefer FTDNA since it's primarily for genealogical research, not for medical, and they don't resell your data.
- My plan is to continue using GenoPro as my main genealogy software program, and export a GEDCOM file to upload into FTDNA.
- I am considering also uploading a GEDCOM file into xxx, and I see others maintain multiple trees in Ancestry, as well as Family Search, and Geni.com. I would prefer to just maintain everything in one program somehow, instead of up to 6!
|
|
By NiKo - Friday, June 30, 2017
|
Additional info:Would there be an easy way to integrate this blogger's requirements into GenoPro? |
|
By genome - Sunday, July 2, 2017
|
Here are some ideas and thoughts, although I confess to knowing very, very little about DNA testing for genealogy, despite having read some of the articles. I am a little confused by the plethora of tests and testers and how to interpret results.
Any way, here goes - Is there a way to attach small logos to an individual to show which companies and which tests they have done?
I suggest using Social Entities for the companies used and Social Relationships (Customer Of) to link individuals to each company and use comments on the social relationships to shows which tests have been done (and results ??). The gives the visual information and a mouse over on the relationship will display the comments, i.e. tests. See attached .zip of .gno and images.
- Is there a way to highlight, "tested" vs "anticipated" or "expected" results?
The above Social Relationships indicate 'tested', but could be reinforced with a border around the individuals. See attached .zip of ,gno and images.
- when I generate a report, the tool tip and comment are no longer available or accessible
This puzzled me but after much delving I discovered another of the mystic properties of Cascading Style Sheets (or CSS) in relation to web reports. By default pointer/mouse events, e.g. hover for tooltip, are only actioned on 'painted' objects, and the rectangle containing the labels in question had no 'fill' i.e.were unpainted. But Googling informed me I could add ' pointer-events: visible;' to the style and all would be revealed. The attached genomaps.svg file can be dropped in the skins 'Narrative Common\Code' folder overwriting the existing file to fix this. This should getincluded in the next GenoPro update.
- Would there be an easy way to integrate this blogger's requirements into GenoPro?
http://debsdelvings.blogspot.ca/2017/06/one-dna-analysis-chart-process.html?m=1Creating a table in GenoPro using labels could be soul destroying, but it can easily be done using a spreadsheet to create a the necessary GenoPro xml data. I created the attached spreadsheet (GenoPro Table Generator.zip) using Google Sheets and have also saved as Excel format. It can be used to produce any size of table. The following table, consisting of GenoPro Social Entities placed together, is a sample (see attachment table.xml). I have used Social Entities instead of labels so that Social Relationships can be used to link Individuals their column in the table. Instructions are included in the spreadsheet. If you open table.xml with GenoPro you can then copy the table and paste into your own .gno. 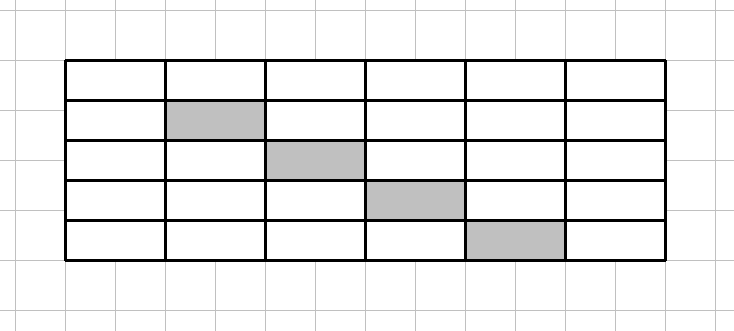 change the labels from tracking Addiction/Mental/Medical related issues to tracking Y-, mt-, autosomal, and perhaps X-DNA? Maybe add a DNA Toolbar?
You can 'commandeer' the genogram addiction/medical toolbar for your own purposes by choosing a little used Language (e.g. Afar or AA) and use Language / Translate Menus to change text associated with those symbols, found near the bottom of the list.
|
|
By NiKo - Sunday, July 2, 2017
|
Thank you genome :-)
It will take me a bit to digest everything you've provided. And I agree, all the testing companies, acronyms, etc etc get very confusing and overwhelming. Watching some youtube videos by Maurice Gleeson helps quite a bit. Question re: the Social Entitiies showing which companies they test with. -Say I have 20 relatives test with company FTDNA. --Do I create one Social Entity on a separate genomap, and hyperlink each person to that genomap? Or..--Somehow show 20 versions of the same Social Entity next to each person (I've never tried hyperlinking a Social Entity)? Or ..--Just copy the Social Entity 20 times and have company FTDNA1 through 20?
If you have the time, I would like 2 reports created in the short term, and 2 some time in the future.-Maurice Gleeson suggests trying to figure out the Y- (paternal) and mt- (maternal) DNA haplogroups of your great-grandparents. For 8 great grandparents, you have 8 types of Y-DNA and 16 types of mt-DNA. It gets a bit laborious going up and down the tree trying to figure out who is descended from great grandparent X..
It would be nice to be able to select one person and run a report to see who possible test candidates are. I will write out a spec when I'm on my laptop.
The future test are for X-DNA for males vs females. |
|
By genome - Sunday, July 2, 2017
|
In answer to Question re: the Social Entitiies showing which companies they test with.
I suggest only one Social Entity per company and you link each of their customers to it using Social Relationships. For example using your template .gno:
Here FTDNA company has two customers, 'sister' & 'brother'. If the GenoMap becomes too cluttered with all the Social Relationship lines then you could just move the company Social Entities to a 'Companies' GenoMap. All Social Relationships linking to them would then be hidden but still exist in the .gno file. To reveal them, simply move the required company (Social Entity) back to the original GenoMap where its customers are.
I have also shown above how the analysis table could be used
|
|
By NiKo - Wednesday, July 26, 2017
|
Awesome, everything looks great.
I will need to mess around with the table generation to make sure it's the right dimensions, and figure out which "medical" icons to rename/relabel and into what.
One thing I can't find is genomaps.svg file that you mentioned a few replies back. Do you mind re-attaching it.
Thanks!
|
|
By genome - Wednesday, July 26, 2017
|
|
Not surprised you couldn't find the attachment, as I forgot to add it. It's there now in the earlier post.
|
|
By NiKo - Saturday, July 29, 2017
|
|
Thanks ... it works great!
|
|
By NiKo - Saturday, January 20, 2018
|
OK .. I've done some DNA testing, have learned a little more about DNA testing, and have played around with Genopro a little more to spell out some requirements a little more clearly.
I think GenoPro is uniquely positioned to combine a graphical view of a family tree and all the data that gets generated from DNA testing and related tools.
A brief high level summary of DNA:
https://www.familytreedna.com/understanding-dna.aspx
So there are 4 main ways we can look at our DNA:
- Y-DNA ... your father's father's father's line .. only men have it .. can be displayed in a regular "patrilineal" genomap
- mt-DNA ... your mother's mother's mother's line ... everyone has it ... but only women can pass it on to their children ... can be displayed in a "matrilineal" genomap
- Autosomal DNA ... we get 50% from each of our parents .. 25% from each grandparent .. 12.5 from each great-great grandparent ... good for looking back 5 or 6 generations and possibly connecting to 5th cousins, etc. ... we can possibly create one or more genomaps to compare subsets of tested people and map which of their chromosomes match and were inherited from specific ancestors
- X-DNA ... men get this from their mother's only, women get it from their mother's and father's ... haven't wrapped my mind around this yet or what I'd like to see.
Possible Visual Labelling:
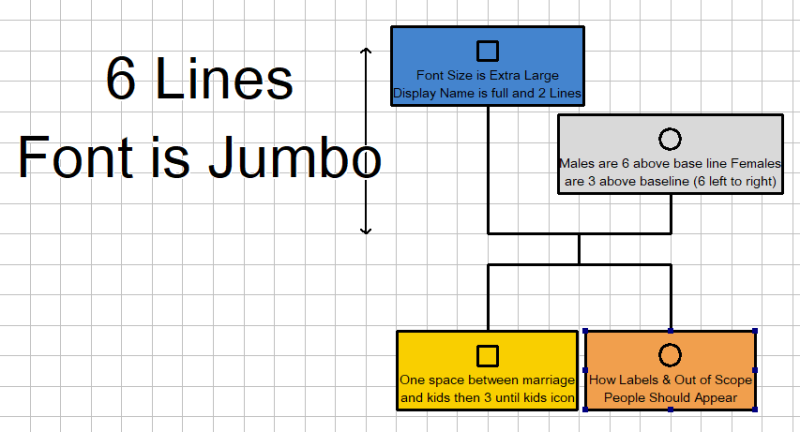 - The dark blue in the upper left represents a person who has taken the biggest/most accurate test possible (eg, Y-111 for Y-DNA, or mt-Full Sequence for mt-DNA)
- The silver in the upper right represents a person who has taken a less accurate test (eg Y-12, -25, -37, or -67 for Y-DNA, or a HVR1, or HVR1 and HVR2 for mt-DNA)
- The orange-yellow in the lower left represents results that have been "populated". Eg, it is assumed someone's father has the same Y-DNA as their son that did the test.
- The orange in the lower right is for labels, and things out of scope.
First off .. Y-DNA:
https://www.familytreedna.com/learn/dna-basics/ydna/
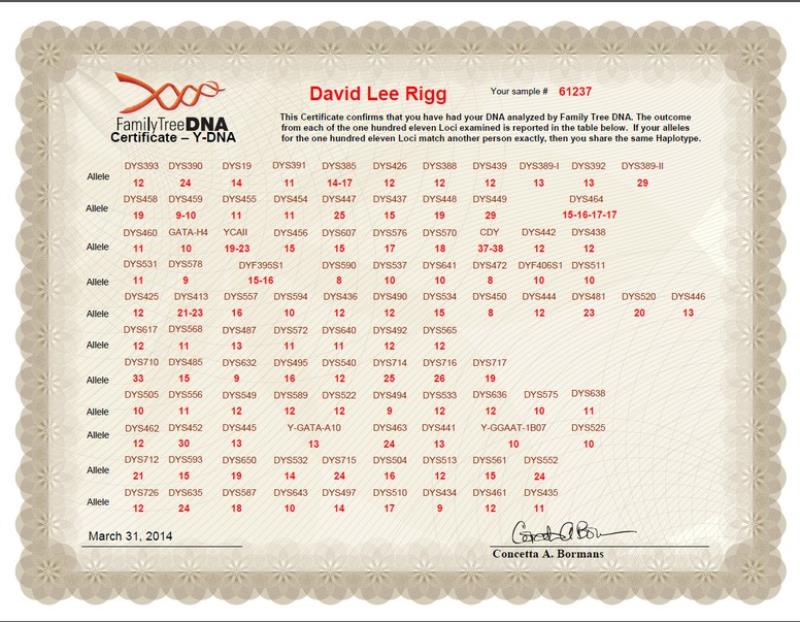
When you get your Y-DNA results back, they will give you a "predicted" Y-Haplogroup and your results will look like this for 25 STR markers:
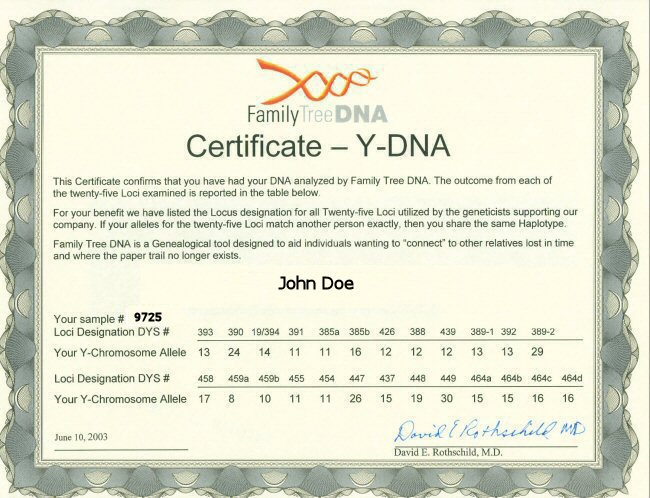
or like this for Y-111:
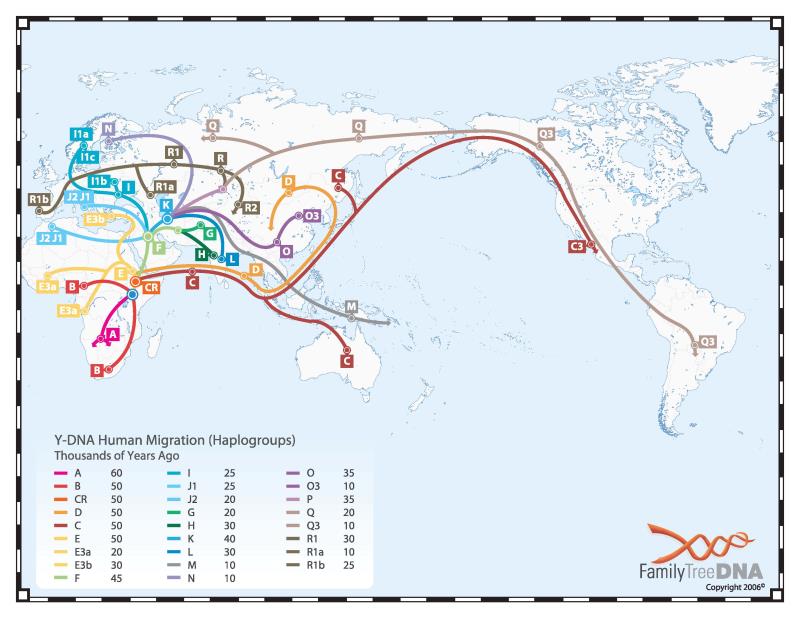
Here's a map of how they thought Y-Haplogroups had migrated in 2006:
It's basically a bunch of random numbers unless you join a Surname or Haplogroup project and compare your STR markers against those with similar markers.
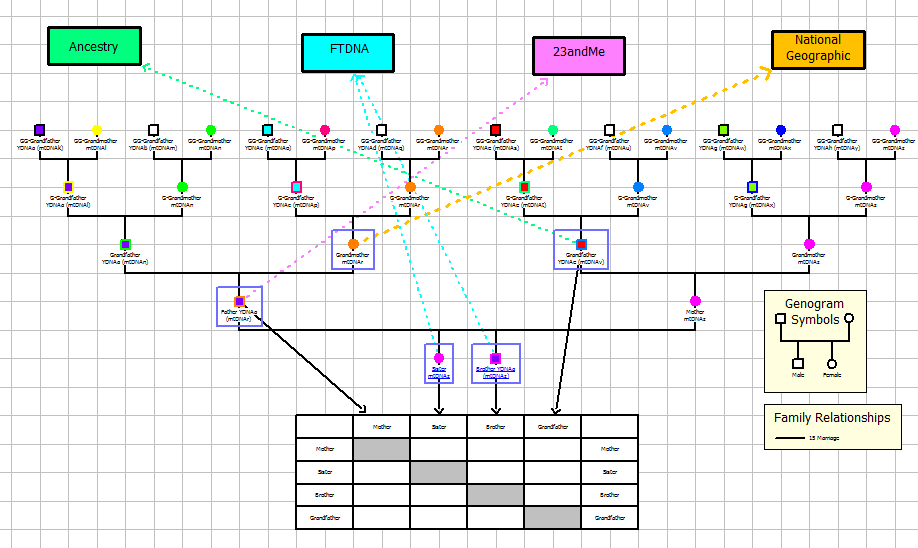
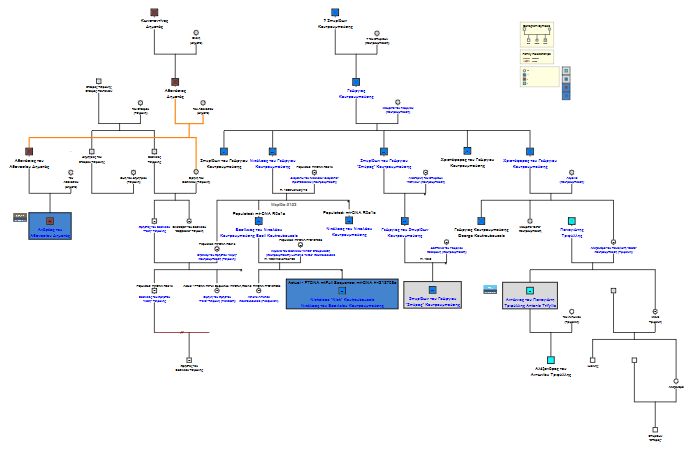
Here's a genomap of one family where 4 people have done Y-DNA tests:
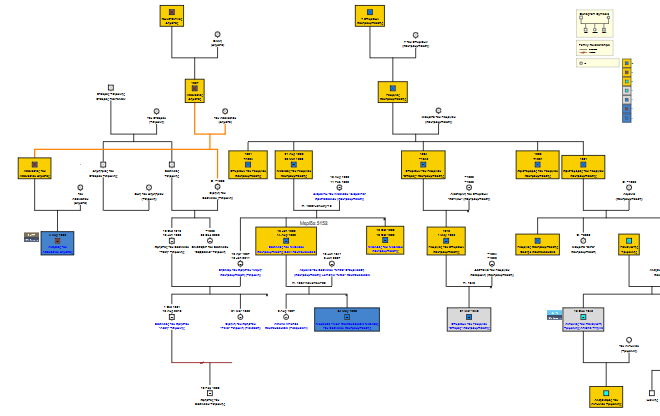 - Two men outlined in darker blue have done Y-111 tests ... and belong to different "haplogroups":
- one is R-M269 (on the left of the genomap) .. and I labelled him and his male line with "brown" (there are 4 men with brown gender symbols)
- another is I-P37 (in the lower centre/left) and I labelled him and his male line with a darker blue in their gender symbol
- Two men are outlined in silver have down Y-12 tests
- They are both 2nd cousins of the I-P37 tester
- The one just to the right of him is the same haplogroup and has darker blue in their gender symbol,
- And the one further to the right is a different haplogroup (J-M27) and has cyan in their gender symbol
- All the males ancestors and descendants of these men are outlined in orange-yellow
- Women and men from separate/unknown lines have no outline
Here is the set of Tags I have started setting up for Y-DNA:
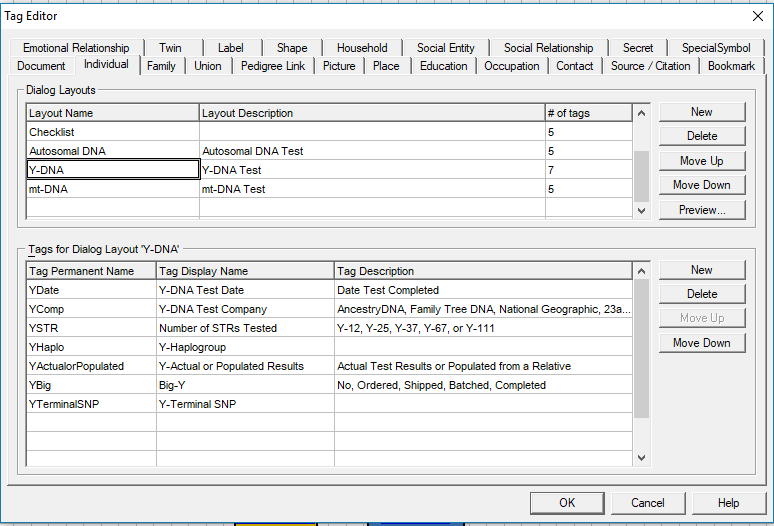
I will probably eventually add 111 tags to this to represent all the STR test results. Here is a list of them:
https://en.wikipedia.org/wiki/List_of_Y-STR_markers
They are usually shown in colorized tables like this: The markers highlighted in purple mutate faster than the markers in blue.
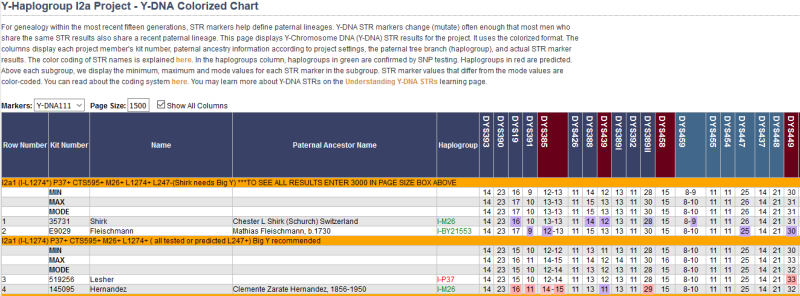
The STRs slowly mutate over time:
https://isogg.org/wiki/Mutation_rates
Here is someone who has started mapping their family's Y-DNA mutation history:
http://hurlbutdna.pbworks.com/w/page/19764793/Mutation%20Descent%20Chart

Here is another one from Skip Duett:
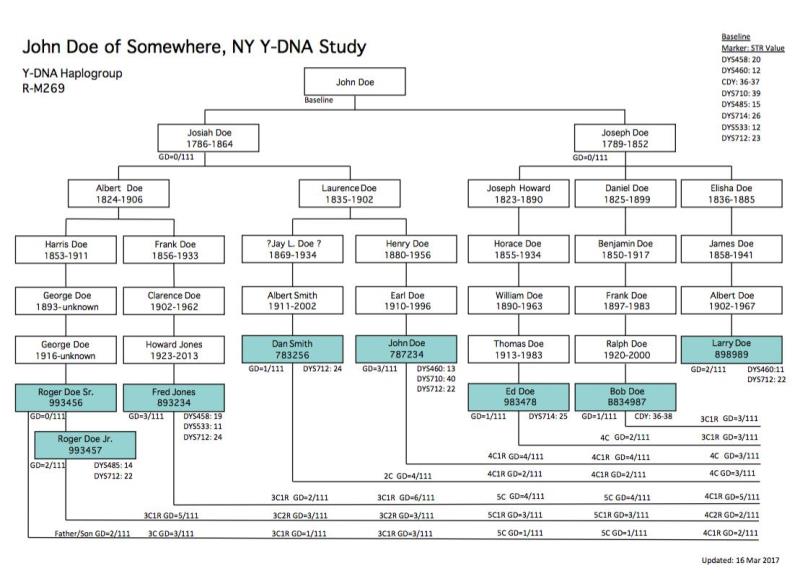
GD=x/111 means the "Genetic Distance" at 111 markers = x, and then he spells out which ones don't match/have mutated.
REQUESTS:
- Is there a way I can change the Legend so it will say: "I-P37 Y-Haplogroup" if the inside of the gender symbol is blue, and "xxxx" if it's another colour?
- Is there a way I can get it to say "Actual" or "Populated" depending on the colour of the outer shading?
- The Legend doesn't seem to accurately count the number of women and men that don't have any colouring. It just lists them all as 32 women.
- For the Y Tag field: YActualorPopulated ... if it's Populated .. can I somehow show which relative it pulled the data from. Or show that the data is "expected" or "populated" and not "Actual" data?
- Perhaps another Colour can be added for an NPE (Non Paternal Event or Not Parent Expected). ie, you would expect your brother to have the same Y-DNA as you, but he doesn't due to infidelity, adoption, etc
- https://en.wikipedia.org/wiki/Non-paternity_event
- https://www.goodreads.com/book/show/29588109-the-stranger-in-my-genes
- Is there a way to add a Social Relationship between 2 men, and when I hover over the relationship display .... or create a Table where all the information is displayed:
- Their relationship: 2nd Cousin, 3rd cousin, Uncle, Nephew, Brother, etc
- A graphic of their Kinship Relationship. I don't mind running it separately for a small number of people, as long as I can insert it as a .png. It gets output as a .pdf file and I don't want to take screenshots.
- Show the Genetic Distance and mutating STRs?
|
|
By NiKo - Saturday, January 20, 2018
|
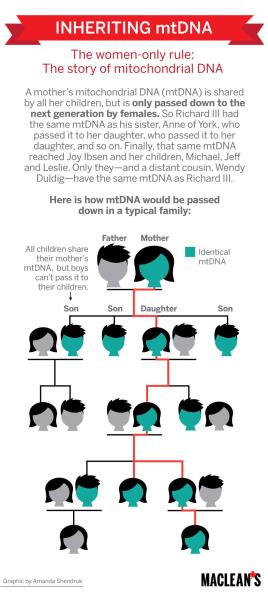
Mitochondrial DNA (mt-DNA) is passed from a mother to her children, and has a very low mutation rate. So a man's mt-DNA matches his mother's but he does not pass his on.
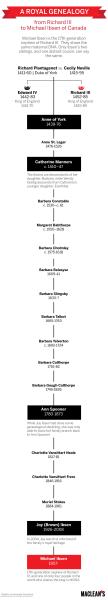
It was used to confirm Richard III was buried under a parking lot in England by matching it to living descendants.
Here is an image of how it is passed on:
And here is how they matched Richard III to a living descendant:
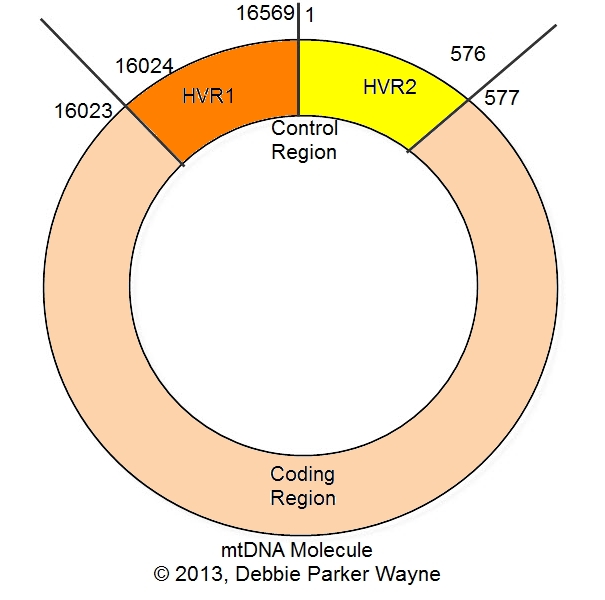
mt-DNA is a ring, as shown below. Initial tests only looked at HVR1 (Highly Variable Region 1), then expanded to include HVR2, and finally HVR1, HVR2, and the Coding Region.
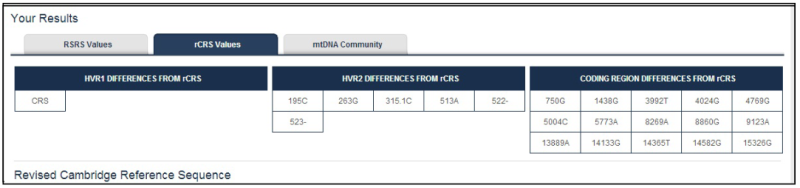
Your results are presented by showing where they differ from a set standard (rCRS) in each of the 3 regions:
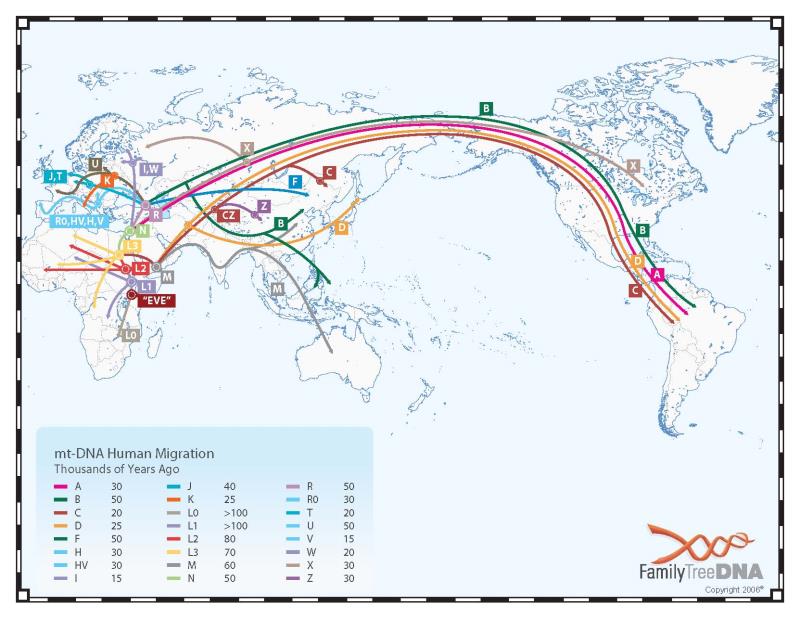
And they give you a map to show where your maternal line migrated from:
All the various mt-DNA Haplogroups are managed on this site, if you want to see how the various branches are connected to one another.
http://www.phylotree.org/
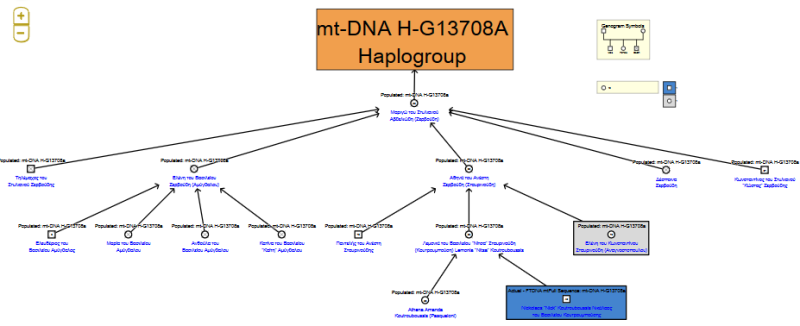
So, I applied the same display rules as in the Y-DNA chart:- Dark Blue = full mt-DNA sequence
- Silver = just HVR1 or HVR1 and HVR2
- Yellow-Orange = populated test results
- Orange = Labels/Social Entities
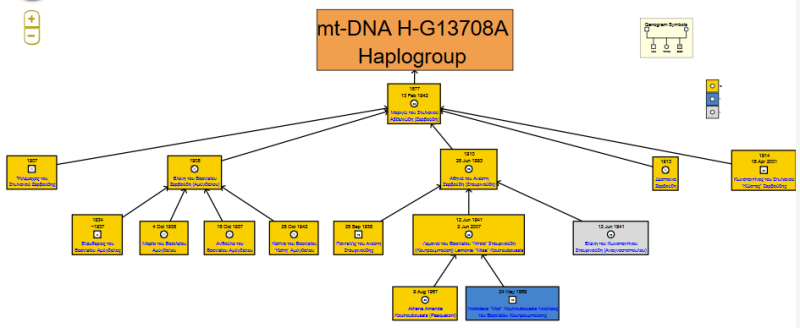
I list each individual as a "Subordinate" of their mother, and I connect the oldest matriarch to the mt-DNA Haplogroup.
Once again, I'm having issues with the Legend appearing correctly. It's lumping all the men and women in orange into one category. Is there a way to change the legend labels?
The tags I've created so far are:
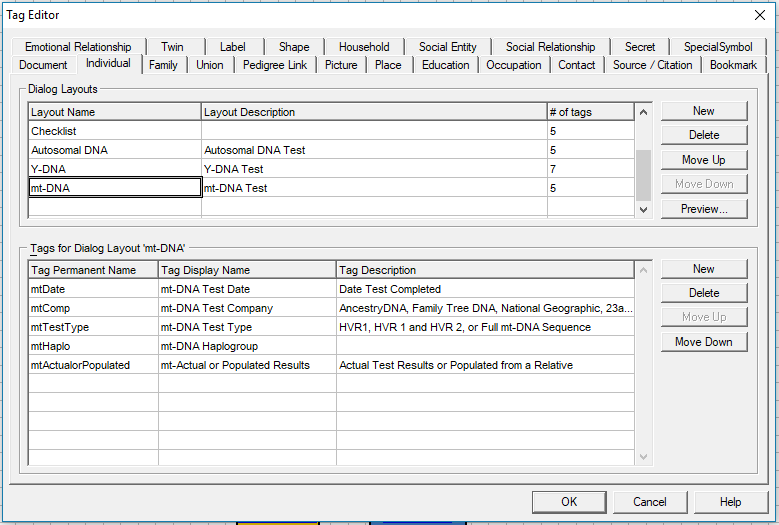
I haven't added fields yet for the various HVR1, HVR2, and coding region results .... I am not sure how to enter data where there may be 0, 1 or n results. For example, in the above test results, HVR1 had 1 delta, HVR2 had 6, and the Coding Region had 15 items. Any suggestions?
Would there be a way to generate a report to identify which people have matching mt-DNA, or include it in the narrative report?
|
|
By NiKo - Sunday, January 21, 2018
|
From Edward Tufte's Beautiful Evidence ... p. 79... subheading Efficiency of Design he says "... the omnipresent boxes of organization charts are rarely needed. If every name is highlighted, no name is. .... Omitting boxes increases explanatory resolution."
So, I modified the design of the mt-DNA and Y-DNA charts.
Instead of putting boxes around all the "populated" results, I changed the Display setting to show that their mt-DNA Haplogroup has been Populated.
- Can the Legend be fixed?
- Can the Display be unique for these mt-DNA genomaps (ie, to display a certain tag), while other genomaps display Birth and Death Dates or other tags?
- Is there a way text can appear above the Social Relationship lines? (eg, Subordinate, # of cM shared, relationship, etc)
I removed all the "populated" boxes on the patrilineal/Y-DNA genomap too, and increased the size of the gender icon for the males where I think I know their Y-DNA.
- Once again, can the Legend be fixed?
- Can the Tags displayed be different that what is set for other genomaps?
- Can I add/link Icons next to certain individuals to show what level of testing they have done? for example:
      ... etc .. and which Haplogroup they are: ... etc .. and which Haplogroup they are:  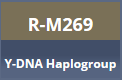 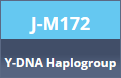 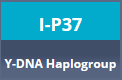
The technology is rapidly advancing, so what was previously incredibly expensive and time consuming is now possible and affordable.
|
|
By genome - Monday, January 22, 2018
|
Well there is huge amount of information to digest in your posts which I struggled with somewhat as although the fog around DNA has lifted a little it is still not exactly clear to me.But I will try to be of help if I can. As to you latest questions,
1. Can the legend be fixed?
A. Rather than hoping for a fix in GenoPro, very unlikely as GenoProX is the focus, why not roll your own legend? The legends are purely standard GenoMap elements e.g. labels and individuals (albeit with mark as label'' flags set) you can create it yourself. OK it will not have the counts GenoPro inserts when creating a legend but I doubt if they are of great benefit. Here is one I started: 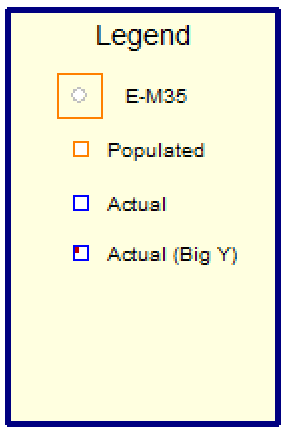 Note that I am suggesting a different labelling scheme here, with the border colour indicating Haplogroup, the gender symol colour indicating, Actual test, populated result etc, and what are originally medical condition indicators re-purposed as type of test /NPE indicators. The latter is achieved by setting your language to one that is geneerally not used e.g. code AA (or Afar) and then under Languages / Translate Menus set as follows at the bottom of the list 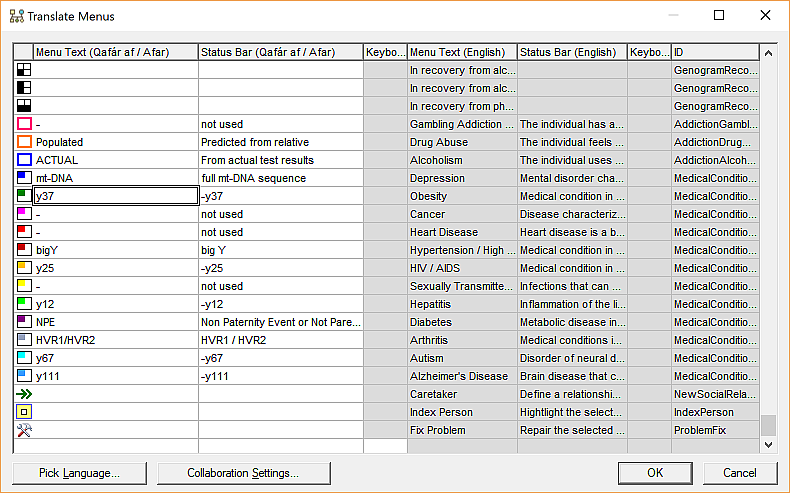 In this way when you hover over an indiviudual GenoPro will give a tooltip with for example the value 'Actual, BigY' GenoPro also displays any comments associated with that individual and so I suggest you store genetic distance and any differences in the first line of comments e.g. 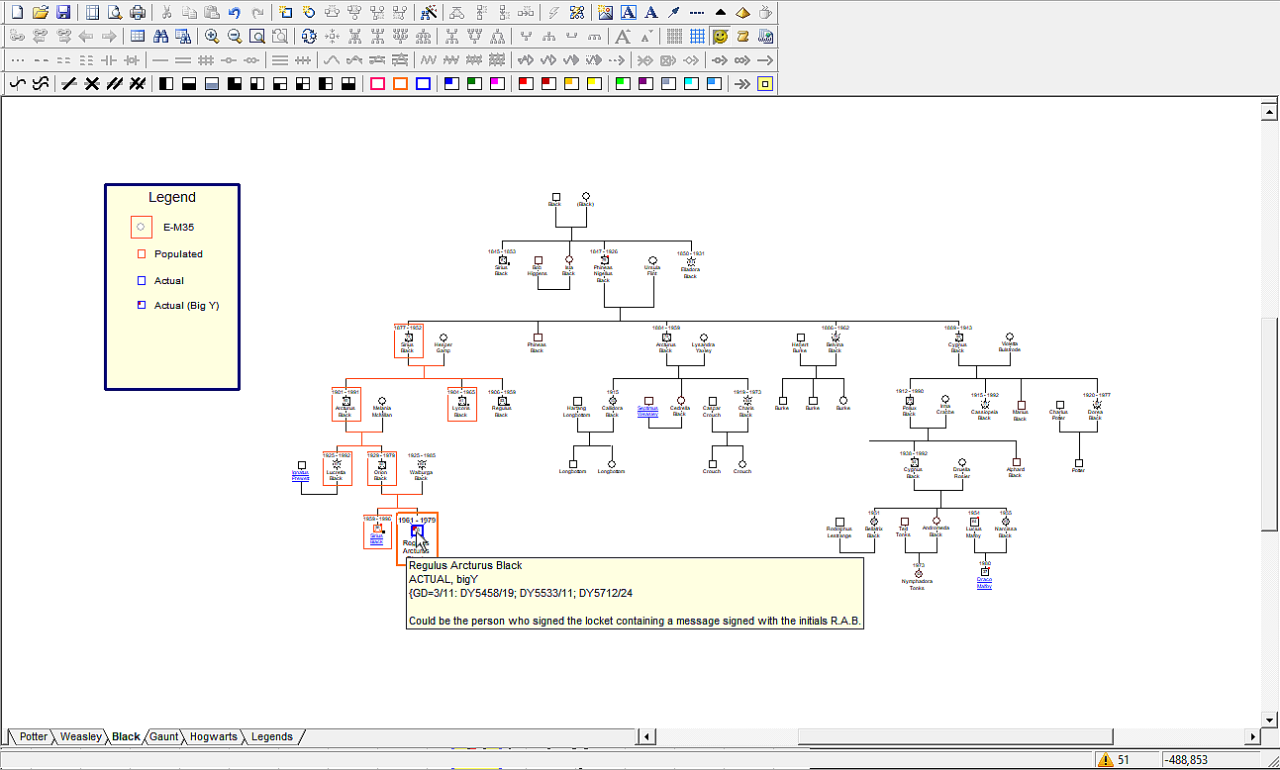 Note that these translations do not appear on genomaps generated by the Narrative Report nor do the original medical conditions.2. Can the Tags displayed be different that what is set for other genomaps?All tags must be the same source, the only way I can think off of achieving what you ask is to use a custom tag for the display tag and then somehow populate that tag with either your dna data or the standard e.g. YoB-YoD. This would require say an modofication to the XML Toolkit or a bespoke report skin to do this by generating the custom tag from your dna custom tags or DoB DoD as required.
3. Can I add/link Icons next to certain individuals to show what level of testing they have done? for example:
Yes of course you can use labels or social entities with pictures to add the extra graphics to your GenoMap, or maybe the labelling scheme I have outlined above will suffice?
In your earlier post you asked:6. Is there a way to add a Social Relationship between 2 men, and when I hover over the relationship display .... or create a Table where all the information is displayed:
Any info you put in the comment field of the SR will show in tooltip, but again some scripting/programming would be required to automatically populate the comment with kinship details
|
|
By a2jc4life - Sunday, March 11, 2018
|
I'm totally new to GenoPro, so take this with a grain of salt (I'm only vaguely familiar with the features), but I'm fairly familiar with genetic genealogy, so I've been mulling over a lot of the same questions.
Depending on how much information you want to be able to see at a glance, you can make the solution very complex or pretty simple. I'm thinking, for instance, to show mtDNA heritage simply by changing the display color of the icon used for the individuals in the matrilineal line. Custom tags seem like a pretty simple way to indicate who has tested with what company/ies, and their results in the match lists at the various sites can (as far as I can tell) even be linked. (THAT seems very handy!)
|
|