|
By JUNO - Monday, August 19, 2024
|
Can i generate from the information on a tree, those people alive at the same time - in the form of a visual table, I dont want a list.
I have made one manually but its tedious and the information is already on the trees. can anyone advise please
|
|
By genome - Tuesday, August 20, 2024
|
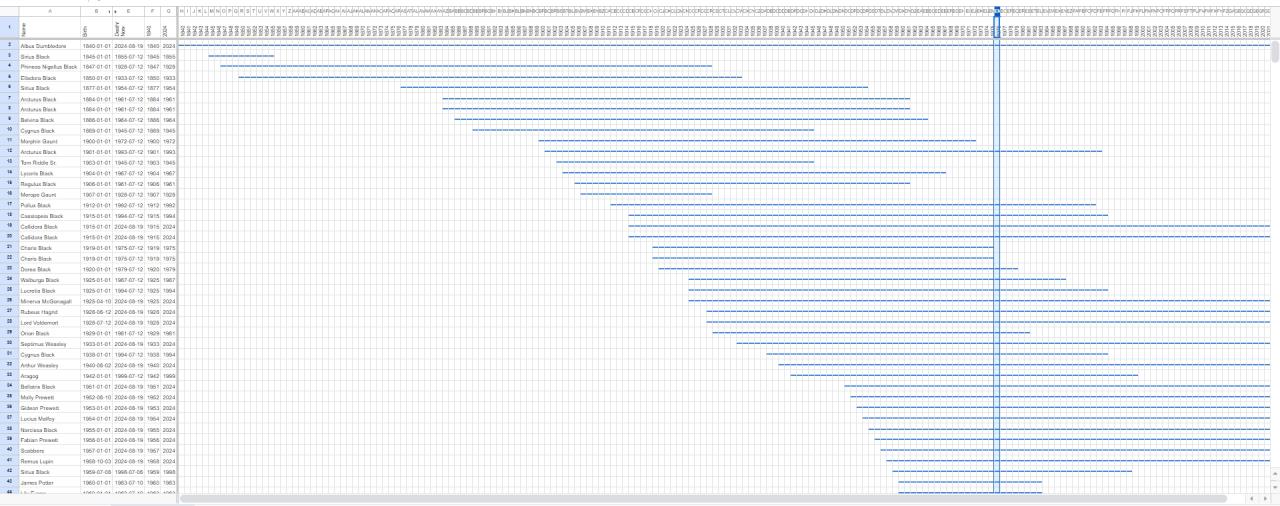
My reply to you in a previous thread, https://support.genopro.com/Topic43586.aspx, provided a solution to this. I appreciate that not everyone is happy manipulating spreadsheet formula and data.That solution gave a vertical timeline, so a horizontal line for a given year shows who was alive in that year. Using the same 'Comma Separated Values' (.csv) data generated by the Report Skin Template attached to that post it is possible using Google Sheets (free!) to create a horizontal timeline of the data. Selecting a column, i.e. year, . e.g. 1976 below, will highlight those alive in that particular year.  a PDF print of that spreadsheet is attached. Unfortunately I do not have the skill/time to automate the production of such a spreadsheet. Here is a link to this Google Sheet that you can examine etc. to see how it works. https://docs.google.com/spreadsheets/d/1B3JXtz_K99FJ9K-S21Nd0j9QBpUjdlfryFuMdieeRQg/edit?usp=sharingA brief summary of what I did: 1. Hide columns C & D as not required. 2. Change column heading B & E 3. Add Columns F & G to have year of birth, year of death (or current year if not dead) using formula ABS(LEFT(B2,4)) & ABS(LEFT(E2,4)) respectively4. set F1 to formula MIN(F2:F) and G1 to formula MAX(G2:G)5. add columns from earliest year (e.g. cell F1) to maximum year (i.e. cell G1) and set contents to appropriate year.(hint: set the 1st 2 values H1 & I1, then select I1 and drag from bottom right corner across to last column)6. rotate text in row 1 and set font size in this row to 97. Set formula in cell H3 to IF(AND(abs(H$1)>=abs($F3),abs(H$1)<=abs($G3)),"▬","") and then drag to all cells to bottom right8. set text colour in these cells to blue.9. sort the data on column B (birth)
|
|
By LysanneWeimann - Wednesday, January 15, 2025
|
|
Thank you for providing the information, I am doing as you said, if I have any questions, I will contact you later. |
|