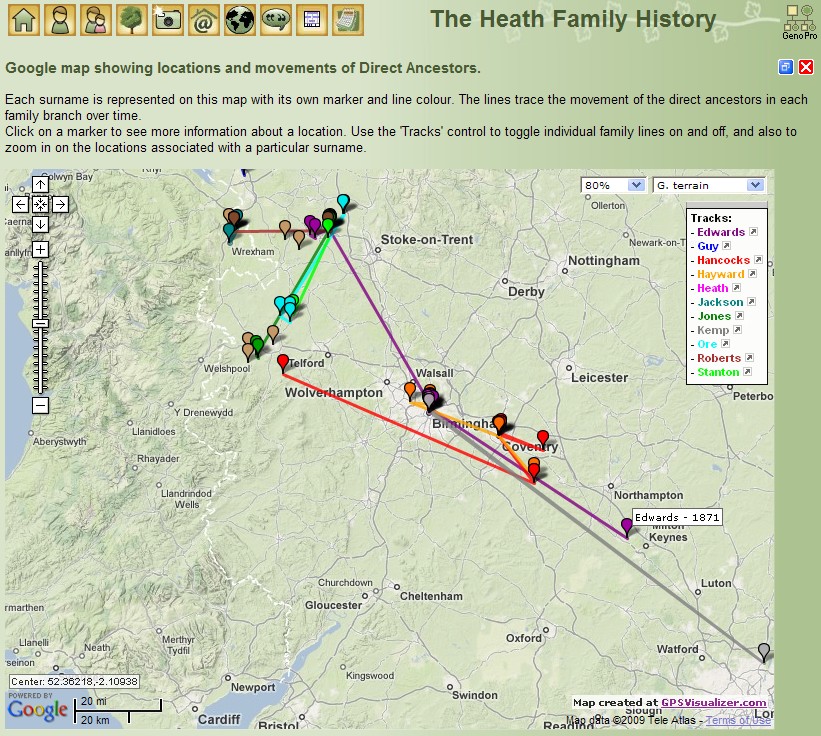
I wanted to share the progress I've made on producing a map representing the movement of families. Here is a screenshot, then I'll go into a bit of detail about how it was generated etc... 
I've found a website which can generate the maps, which can then be saved and loaded as an iframe in the Narrative report : http://www.gpsvisualizer.com/map_input?form=google
The website is aimed at people uploading their data from their gps devices (runners, cyclists, hot air balloonists, etc), so in order to get it to draw lines, you've got to enter some spurious time/speed info.
The website allows you to upload comma separated files containing the gps and marker data. There is great documentation on the site, so I won't reproduce it here, but here is a portion of the csv files I uploaded to create the above map.
The file to create the markers is simple :
name,colour,description,lat,lon
"Roberts - 1851, 61",brown,"Gresford under the Hill, Denbighshire, Wales",53.087555,-2.966352
"Roberts - 1763, 1804, 32, 61, 65, 71",brown,"Gresford, Denbighshire, Wales",53.087014,-2.967682
"Roberts - 1881",brown,"Station Street (no 40), Monks Coppenhall, Crewe, Cheshire",53.089823,-2.434545
"Roberts - 1891",brown,"Christ Church, Crewe, Cheshire",53.096847,-2.440038
"Roberts - 1897",brown,"Carlisle Street (no 4), Monks Coppenhall, Crewe, Cheshire",53.086911,-2.449458
"Roberts - 1901",brown,"Walthall Street (no 239), Monks Coppenhall, Crewe, Cheshire",53.088934,-2.445638
"Stanton - 1768", 1806, 41",lime,"Stanton upon Hine Heath, Shropshire",52.811634,-2.641997
"Stanton - 1881",lime,"Bella Terrace, Shavington, Cheshire",53.062856,-2.450337
The file to create the lines (a track in the terminology of gpsvisulizer) is a little less obvious : type,trackpoint,name,colour,lat,lon,speed,time,BOT,EOD
t,1,Roberts,brown,53.087555,-2.966352,1,12:00:00,1,
t,2,,,53.087014,-2.967682,1,13:00:00,,
t,3,,,53.089823,-2.434545,1,14:00:00,,
t,4,,,53.096847,-2.440038,1,15:00:00,,
t,5,,,53.086911,-2.449458,1,16:00:00,,
t,6,,,53.088934,-2.445638,1,17:00:00,,1
t,1,Stanton,lime,52.811634,-2.641997,1,12:00:00,1,
t,2,,,53.062856,-2.450337,1,13:00:00,,1
The first column tells gpsvisulizer it is a "track", the second is the sequential number of the track point. Then you have the track name and colour (which only have to be set for the first point on the track).
Lat and Lon are obvious. The next two fields are spurious & arbitrary from our perspective, but seem to be necessary to get the "track" to draw - they're a fictional speed and time at each track point, I chose to increment the time by one hour for each track point.
The last two fields stand for "Beginning Of Track" and "End of Track" - use value of 1 if it is. It's just a way of having several "tracks" in one file.
Once you've got gpsvisulizer to create the map it gives you a link for saving it - (basically it opens the map on it's own, so you can right click and save the source code locally).
In terms of getting it to load in the Report, I've followed the advice of the gpsvisulizer site, and used an iframe.
<iframe src="my_map.html" width="600" height="400" marginwidth="0" marginheight="0" scrolling="no" frameborder="0">
<a href="my_map.html">Click here for the map</a>
</iframe>
As for getting the data out of GenoPro and munged into the right format - well that was a manual process copying the data from the Individuals, Places and Contacts tables into excel, with some judicious vlookups to bring the surnames, dates, places, and lat/lon information together on one sheet. (I can't code for toffee, but I'm sweet with Excel.)
It's been a fair amount of work, not least of which was researching the lat/lon for all the locations in my family tree (600+, with many streets which no longer exist - so some sleuthing was required there).
Hope this is of some use to others out there.