|
|
|
|
Administrators
Customers
Important Contributors
FamilyTrees.GenoPro.com
GenoPro version: 3.1.0.1
Last Login: 2 days ago @ 8:34 PM
Posts: 3,496,
Visits: 27,391
|
I have grabbed the html from your ideogram example page and added a button to it allowing selection of a file with the required DNA data. I have changed the script to compare human/human rather than human/mouse but this fails part way through with the original human/mouse DNA data.
 Error: Uncaught (in promise) Error: Base pair out of range. bp: 91666767; length of chr17: 83257441I assume that this is because the mouse data does not match the spec for human data. If you are able to prepare the data for two humans in the required format it should work? I attach the html file and original sample.txt data. download .html and double click to run then chick choose file button and select your data file. The graph can then be captured and saved from the page. I suggest the graphic can be included on your GenoMap as the primary picture of a Social Entity. Social Relationships can then be used to connect this to the two individuals involved. You can then easily see the graphic from the property dialogue of the Social Entity and clicking the thumbnail image resulting in the full size image being displayed. e.g. 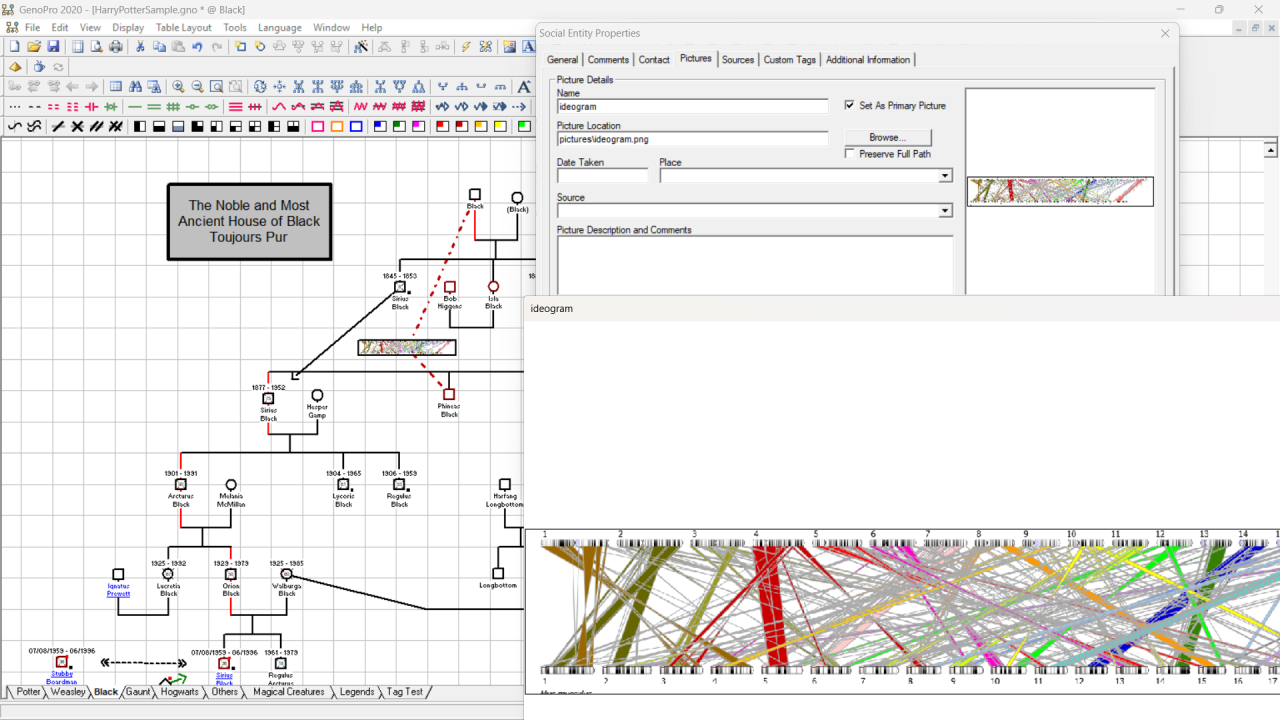
'lego audio video erro ergo disco' or "I read, I listen, I watch, I make mistakes, therefore I learn"
 genome-alignment.html
(36 views,
3.37 KB)
genome-alignment.html
(36 views,
3.37 KB)
 sample.txt
(39 views,
21.32 KB)
sample.txt
(39 views,
21.32 KB)
|
|
|
|
|
Customers
FamilyTrees.GenoPro.com
GenoPro version: 3.1.0.1
Last Login: Monday, July 13, 2026
Posts: 272,
Visits: 1,794
|
Well, my knowledge of genetics could be written on a postage stamp and so I do not really understand what ideogram.js is trying to achieve.
I believe the example in your opening post compares DNA of human beings and a house mouse, i.e. two different species. So I am not sure what it would achieve using ideogram.js in this way with two related individuals, would there not be some many lines marking similarities that it would be impossible to see the wood from the trees?If you are comparing a close relative, like a sibling where you share ~50& of your DNA (say, 39 distinct segments), yes, it would get very busy.
If you compared your DNA to a 2nd Cousin's, where you share ~3.14% of your DNA and have common Great Grandparents (say 8 or 9 distinct segments), it would (hopefully) be less cluttered.
Yes, I saw it compared human DNA to mouse DNA, but figured it would be an easy switch to human-human DNA.
Anyway, as to integrating this library into GenoPro or its Report Generator would not be feasible or necessary. Thank you.
Not feasible because GenoPro uses an ancient Microsoft javascript engine, JScript, that is not compatible with modern Javascript libraries that use Google's V8 engine, and so the code in ideogram.js would need modification. Understood.
Not necessary because a similar result could be obtained by generating the graphs external to GenoPro and importing the graph images into GenoMaps or as Pictures on Individuals.
The web page 'genome-alignment.html' used in the ideogram.js example can be easily converted into a free standing 'app' to accept dna details of two individuals and produce the graph as a web page from which the image could be saved. However DNA data needs to be presented in a particular way in a 'Tab Separated Variable', or .tsv, file with side by side DNA ifo.
The first few lines of the sample file homo_sapiens-mus_musculus-synteny-v73.tsv look like
#Species1: homo_sapiens#Assembly: GRCh37#Species2: mus_musculus#Assembly: GRCm38# eweitz: Using GRCh38 instead of GRCh37. TODO: Support `assemblies` in multi-organism Ideogram.# eweitz: Provenance: http://webclu.bio.wzw.tum.de/cgi-bin/syntenymapper/get-species-list.py#ID Chromosome_spec1 Start_spec1 End_spec1 Chromosome_spec2 Start_spec2 End_spec2 Dir44632 chr2 190506076 196592789 chr1 46812285 53360818 -144533 chr15 22833222 23396962 chr7 55793904 56188883 -144532 chr14 58666612 106375879 chr12 70937761 113525420 144535 chr15 28815855 28927409 chr7 56049949 56188883 1
I do not understand what these data represent or how they are derived. I attach the actual file but renamed as .txt instead of .tsv due to forum restrictions on file types.There are a handful of companies that do most of the Autosomal DNA testing today (ie, Ancestry DNA, MyHeritageDNA, Family Tree DNA, and 23andMe).
Autosomal DNA just means Chromosome 1 through 22. You get half of each chromosome from your father, and half of each from your mother.
Most companies offer some type of "Chromosome Browser", so you can see exactly which segments you share with each of your matches, and download the details in a spreadsheet if you want. If not (as in the case of Ancestry DNA), you can download your "raw data" and import it to a 3rd party website (GEDmatch) and see the segment details there.
For example, in the image below of my 1st Chromosome, I am the grey background. The orange on the bottom shows the 4 segments I share with my sister, and the red shows the 2 segments I share with a paternal 1st Cousin. The areas highlighted in boxes are "triangulated segments" ... exact matches that we inherited from a common ancestor (one of our grandparents). The rest of orange segments that aren't commonly shared might have been inherited from my maternal side, or might be from my paternal side, but weren't passed down to my 1C. 
I can also download the exact segment details into a spreadsheet: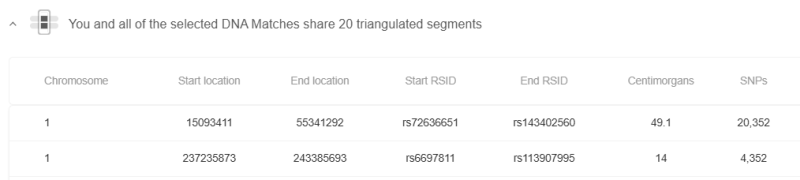
Fields:- Chromosome just tells you which chromosome we are looking at.
- Start and End location tells you the exact location where the matching segment starts and ends. Chromosomes can range in length from ~64 to ~284 million base pairs, so the start and end numbers tend to be quite large.
- Start and End RSID are "names" scientists have given to specific locations. I usually ignore it/don't go to that level of detail. "An rsID (reference SNP ID) is like a genetic “ID number” used to identify specific spots in your DNA where variations, called SNPs (Single Nucleotide Polymorphisms), can occur. Scientists assign each SNP a unique rsID to track it across studies and databases." More details here: https://en.wikipedia.org/wiki/SNPedia
- Centimorgans (cM) is a way they measure the "length" of the segment. Longer segments are better since they are most likely inherited, vs just appearing randomly since you are from the same part of the world.
- SNPs is how many exact spots have been tested in that segment.
You can copy and paste these details into another tool called DNA Painter, to map which segments you inherited from which ancestor/ancestral couple. More details here: https://dnapainter.com/blog/why-map-your-chromosomes/
While DNA Painter is very useful, I want to see the "flow" of DNA down to the current generation in one diagram.
Going back to your question about how the data is derived and what does it mean?
- #ID is a unique identifier for each segment
- Chromosome_spec1 = Chromosome Species 1 tells you which chromosome we are looking at in a human.
- Start_spec1 = Start Location as above
- End_spec1 = End location as above
- Chromosome_spec2 = Chromosome Species 2 maps the chromosome of the human's segment onto whatever chromosome the corresponding segment is for a mouse. In a human-to-human comparison, Chromosome_spec1 would always equal Chromosome_spec2. I'm not sure how they mapped the mouse DNA to human DNA!
- Start_spec2 = The corresponding Start Location for a mouse
- End_spec2 = The corresponding End Location for a mouse
- Dir = I'm not sure .. I see it's either -1 or 1. Direction?
I'm not sure how you would distinguish shared DNA between 7 or more different people, nor highlight triangulated DNA segments.
Edited: Wednesday, January 28, 2026 by
NiKo
|
|
|
|
|
Administrators
Customers
Important Contributors
FamilyTrees.GenoPro.com
GenoPro version: 3.1.0.1
Last Login: 2 days ago @ 8:34 PM
Posts: 3,496,
Visits: 27,391
|
Well, my knowledge of genetics could be written on a postage stamp and so I do not really understand what ideogram.js is trying to achieve.
I believe the example in your opening post compares DNA of human beings and a house mouse, i.e. two different species. So I am not sure what it would achieve using ideogram.js in this way with two related individuals, would there not be some many lines marking similarities that it would be impossible to see the wood from the trees? Anyway, as to integrating this library into GenoPro or its Report Generator would not be feasible or necessary. Not feasible because GenoPro uses an ancient Microsoft javascript engine, JScript, that is not compatible with modern Javascript libraries that use Google's V8 engine, and so the code in ideogram.js would need modification. Not necessary because a similar result could be obtained by generating the graphs external to GenoPro and importing the graph images into GenoMaps or as Pictures on Individuals. The web page 'genome-alignment.html' used in the ideogram.js example can be easily converted into a free standing 'app' to accept dna details of two individuals and produce the graph as a web page from which the image could be saved. However DNA data needs to be presented in a particular way in a 'Tab Separated Variable', or .tsv, file with side by side DNA ifo. The first few lines of the sample file homo_sapiens-mus_musculus-synteny-v73.tsv look like #Species1: homo_sapiens #Assembly: GRCh37 #Species2: mus_musculus #Assembly: GRCm38 # eweitz: Using GRCh38 instead of GRCh37. TODO: Support `assemblies` in multi-organism Ideogram. # eweitz: Provenance: http://webclu.bio.wzw.tum.de/cgi-bin/syntenymapper/get-species-list.py#ID Chromosome_spec1 Start_spec1 End_spec1 Chromosome_spec2 Start_spec2 End_spec2 Dir 44632 chr2 190506076 196592789 chr1 46812285 53360818 -1 44533 chr15 22833222 23396962 chr7 55793904 56188883 -1 44532 chr14 58666612 106375879 chr12 70937761 113525420 1 44535 chr15 28815855 28927409 chr7 56049949 56188883 1 I do not understand what these data represent or how they are derived. I attach the actual file but renamed as .txt instead of .tsv due to forum restrictions on file types.
'lego audio video erro ergo disco' or "I read, I listen, I watch, I make mistakes, therefore I learn"
homo_sapiens-mus_musculus-synteny-v73.txt
(47 views,
21.32 KB)
|
|
|
|
|
Customers
FamilyTrees.GenoPro.com
GenoPro version: 3.1.0.1
Last Login: Monday, July 13, 2026
Posts: 272,
Visits: 1,794
|
Here's a mock up of what I'm trying to describe in the last paragraph.
Two great grandchildren realize they share DNA on Chromosome 7. The red line shows how those segments were passed down to them from their Great Grandparents to their Grandparents to their Parents, and finally to them. There might be multiple lines drawn showing how DNA was passed down through generations.
|
|
|
|
|
Customers
FamilyTrees.GenoPro.com
GenoPro version: 3.1.0.1
Last Login: Monday, July 13, 2026
Posts: 272,
Visits: 1,794
|
Forgive my lack of JavaScript knowledge.
A while back, I stumbled across a JavaScript Library for Chromosome Visualization called ideogram.js
I'm wondering if it can be integrated into GenoPro somehow, either on individual profiles or to display on certain GenoMaps?
Here's a link to the github repository: https://github.com/eweitz/ideogram" Ideogram.js is a JavaScript library for chromosome visualization.Ideogram supports drawing and animating genome-wide datasets for human, mouse, and many other eukaryotes. The Ideogram API for annotations supports histograms, heatmaps, overlays, and points of arbitrary shape and color layered in tracks. The Ideogram API also supports spanning annotations alone, or with heatmaps and histograms. Ideogram can depict haploid, diploid or higher ploidy genomes (e.g. plants), as well as aneuploidy, genetic recombination, and homologous features between chromosomes. Ideogram can be embedded as a reusable component in any web page or application, and leverages D3.js and SVG to achieve fast, crisp client-side rendering. You can also integrate Ideogram with JavaScript frameworks like Angular, React, and Vue, as well as data science platforms like R and Jupyter Notebook." Here is a chart package re: ideogram: https://speakerdeck.com/eweitz/ideogramjs-chromosome-visualization-with-javascript I'm specifically looking at the page titled "Visualize Genome Alignments" 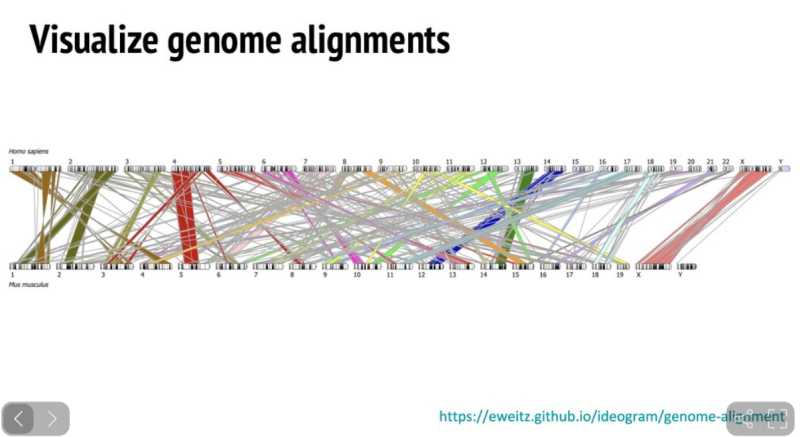
Would it be possible to display an image like this either on individual pages or a GenoMap? For example, if you had a pair of descendants of a set of Great Grandparents that shared DNA, you would show the Great Grandparents at the top, their 2 children, the 2 grandchildren, and the 2 great-children, and then the lines between each generation showing which DNA Segments were transmitted from one generation to the next.
|