"
Ideogram.js is a JavaScript library for chromosome visualization.Ideogram supports drawing and animating genome-wide datasets for human, mouse, and many other eukaryotes. The Ideogram API for annotations supports histograms, heatmaps, overlays, and points of arbitrary shape and color layered in tracks. The Ideogram API also supports spanning annotations alone, or with heatmaps and histograms. Ideogram can depict haploid, diploid or higher ploidy genomes (e.g. plants), as well as aneuploidy, genetic recombination, and homologous features between chromosomes.
Ideogram can be embedded as a reusable component in any web page or application, and leverages D3.js and SVG to achieve fast, crisp client-side rendering. You can also integrate Ideogram with JavaScript frameworks like Angular, React, and Vue, as well as data science platforms like R and Jupyter Notebook."
Here is a chart package re: ideogram: https://speakerdeck.com/eweitz/ideogramjs-chromosome-visualization-with-javascript
I'm specifically looking at the page titled "Visualize Genome Alignments"
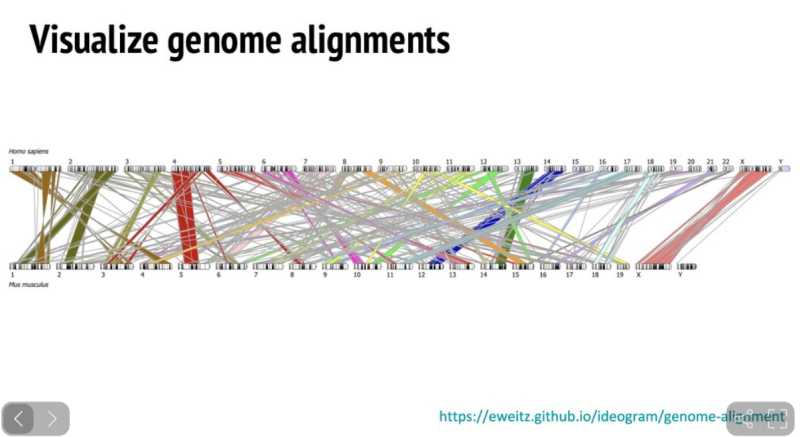
Would it be possible to display an image like this either on individual pages or a GenoMap?
For example, if you had a pair of descendants of a set of Great Grandparents that shared DNA, you would show the Great Grandparents at the top, their 2 children, the 2 grandchildren, and the 2 great-children, and then the lines between each generation showing which DNA Segments were transmitted from one generation to the next.